 OrbFlow Labs
Market Structure + Delta
Reads price structure from confirmed swing points and marks every Break of Structure (BOS) and Change of Character (CHoCH). Each break label also shows the footprint delta of the bar that made it, so you can see whether aggressive buyers or sellers were behind the break, or whether price broke the level on thin, opposing flow. It gives no buy or sell signals.
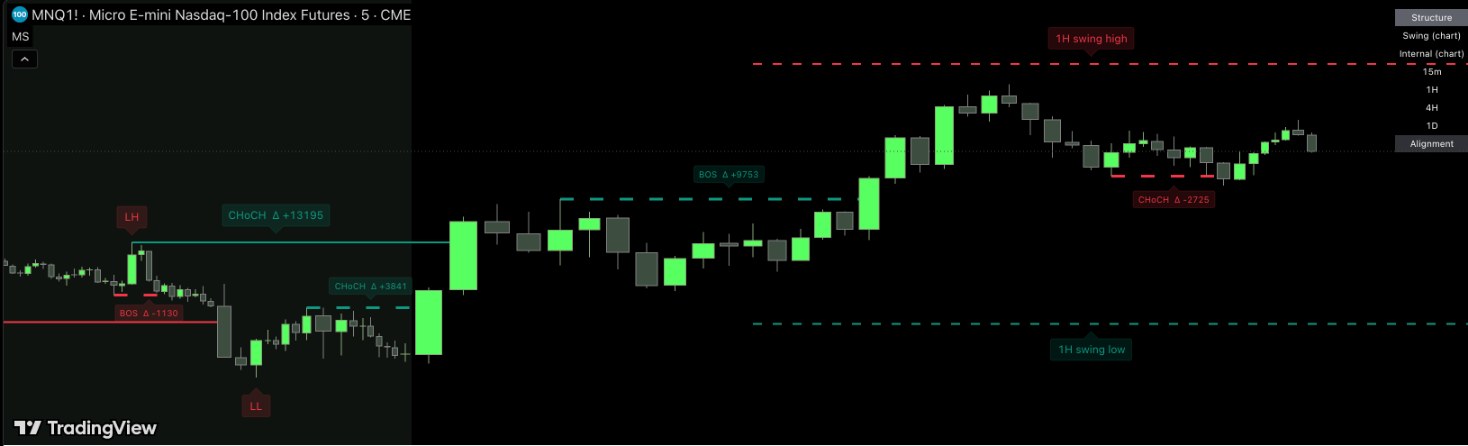
MNQ1! 5-minute, 12 Nov 2026. Labels describe flow that already happened; they don't predict what comes next.
Structure, and the flow behind every break
Two layers of structure
Swing structure (longer pivots, solid lines) and internal structure (short pivots, dashed) side by side, with HH, HL, LH and LL labels on swing points.
Delta on every break
Each BOS and CHoCH label shows the break bar's footprint delta, e.g. BOS Δ +9753. Breaks made against the bar's delta can be drawn faded.
Liquidity and zones
Equal highs and lows (EQH / EQL) within an ATR tolerance, and optional premium and discount zones around the current swing range.
Multi-timeframe dashboard
Swing and internal bias on your chart plus up to four higher timeframes you choose, with an alignment row, using only closed higher-timeframe bars.
Close or wick
Choose whether a break needs a candle close beyond the swing (default) or just a wick. Swing and internal lengths are adjustable for any timeframe.
Limitations
- Footprint delta needs TradingView Premium or higher. Without it the labels show structure only; everything else works.
- Swing points are confirmed late, a set number of bars after they form. They never move once drawn.
- Breaks register only on closed bars, so you're told one bar after the break.
- Higher-timeframe bias updates when that timeframe's bar closes, not mid-candle.
- It's a charting tool, not a strategy. Nothing it shows predicts future prices.